



July 2026 Results
Key takeaways
- Small business long-term optimism improved in early July (58.3), jumping by 8 points since June just before the new tariff escalation with US;
- Short-term optimism also improved to 57.0;
- Price increase plans dropped slightly to 2.7%.
- For the press release, see here.
Small business optimism in Canada
CFIB’s Business Barometer® long-term index, which is based on 12-month forward expectations for business performance, improved in the first half of July to 58.3, about 8 points above June’s reading. The short-term optimism index, based on a 3-month outlook, also increased to 57.0, a healthy jump since June. The survey was conducted from July 7 to 13, just before the latest U.S. tariffs were announced.
Provincial picture
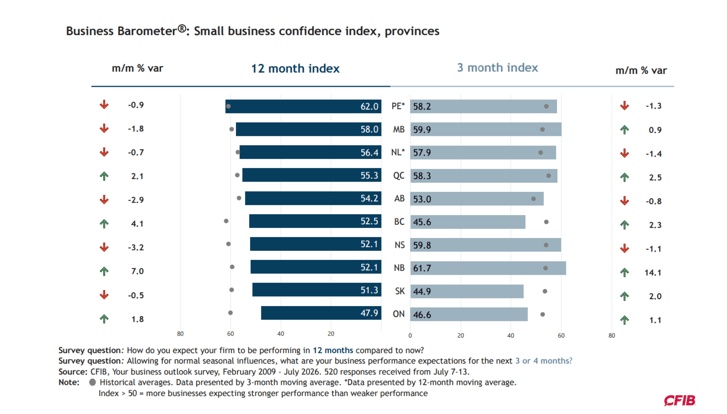
Provincial trends showed some timid signs of improvement. New Brunswick, British Columbia and Quebec saw clear increases in optimism, while Ontario marked a better reading than in June but still far below the other provinces.
Sectoral overview
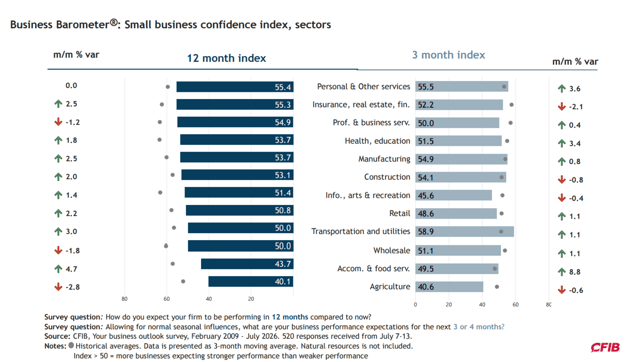
Long‑term confidence, calculated as a three‑month moving average, improved across almost all sectors but remained below potential. With the exception of agriculture and accommodation and food services, all sectors were above the 50 mark, a positive sign. Short‑term confidence was below long‑term confidence in most sectors, indicating that uncertainty continues to weigh heavily on many industries.
Special overview: the manufacturing sector
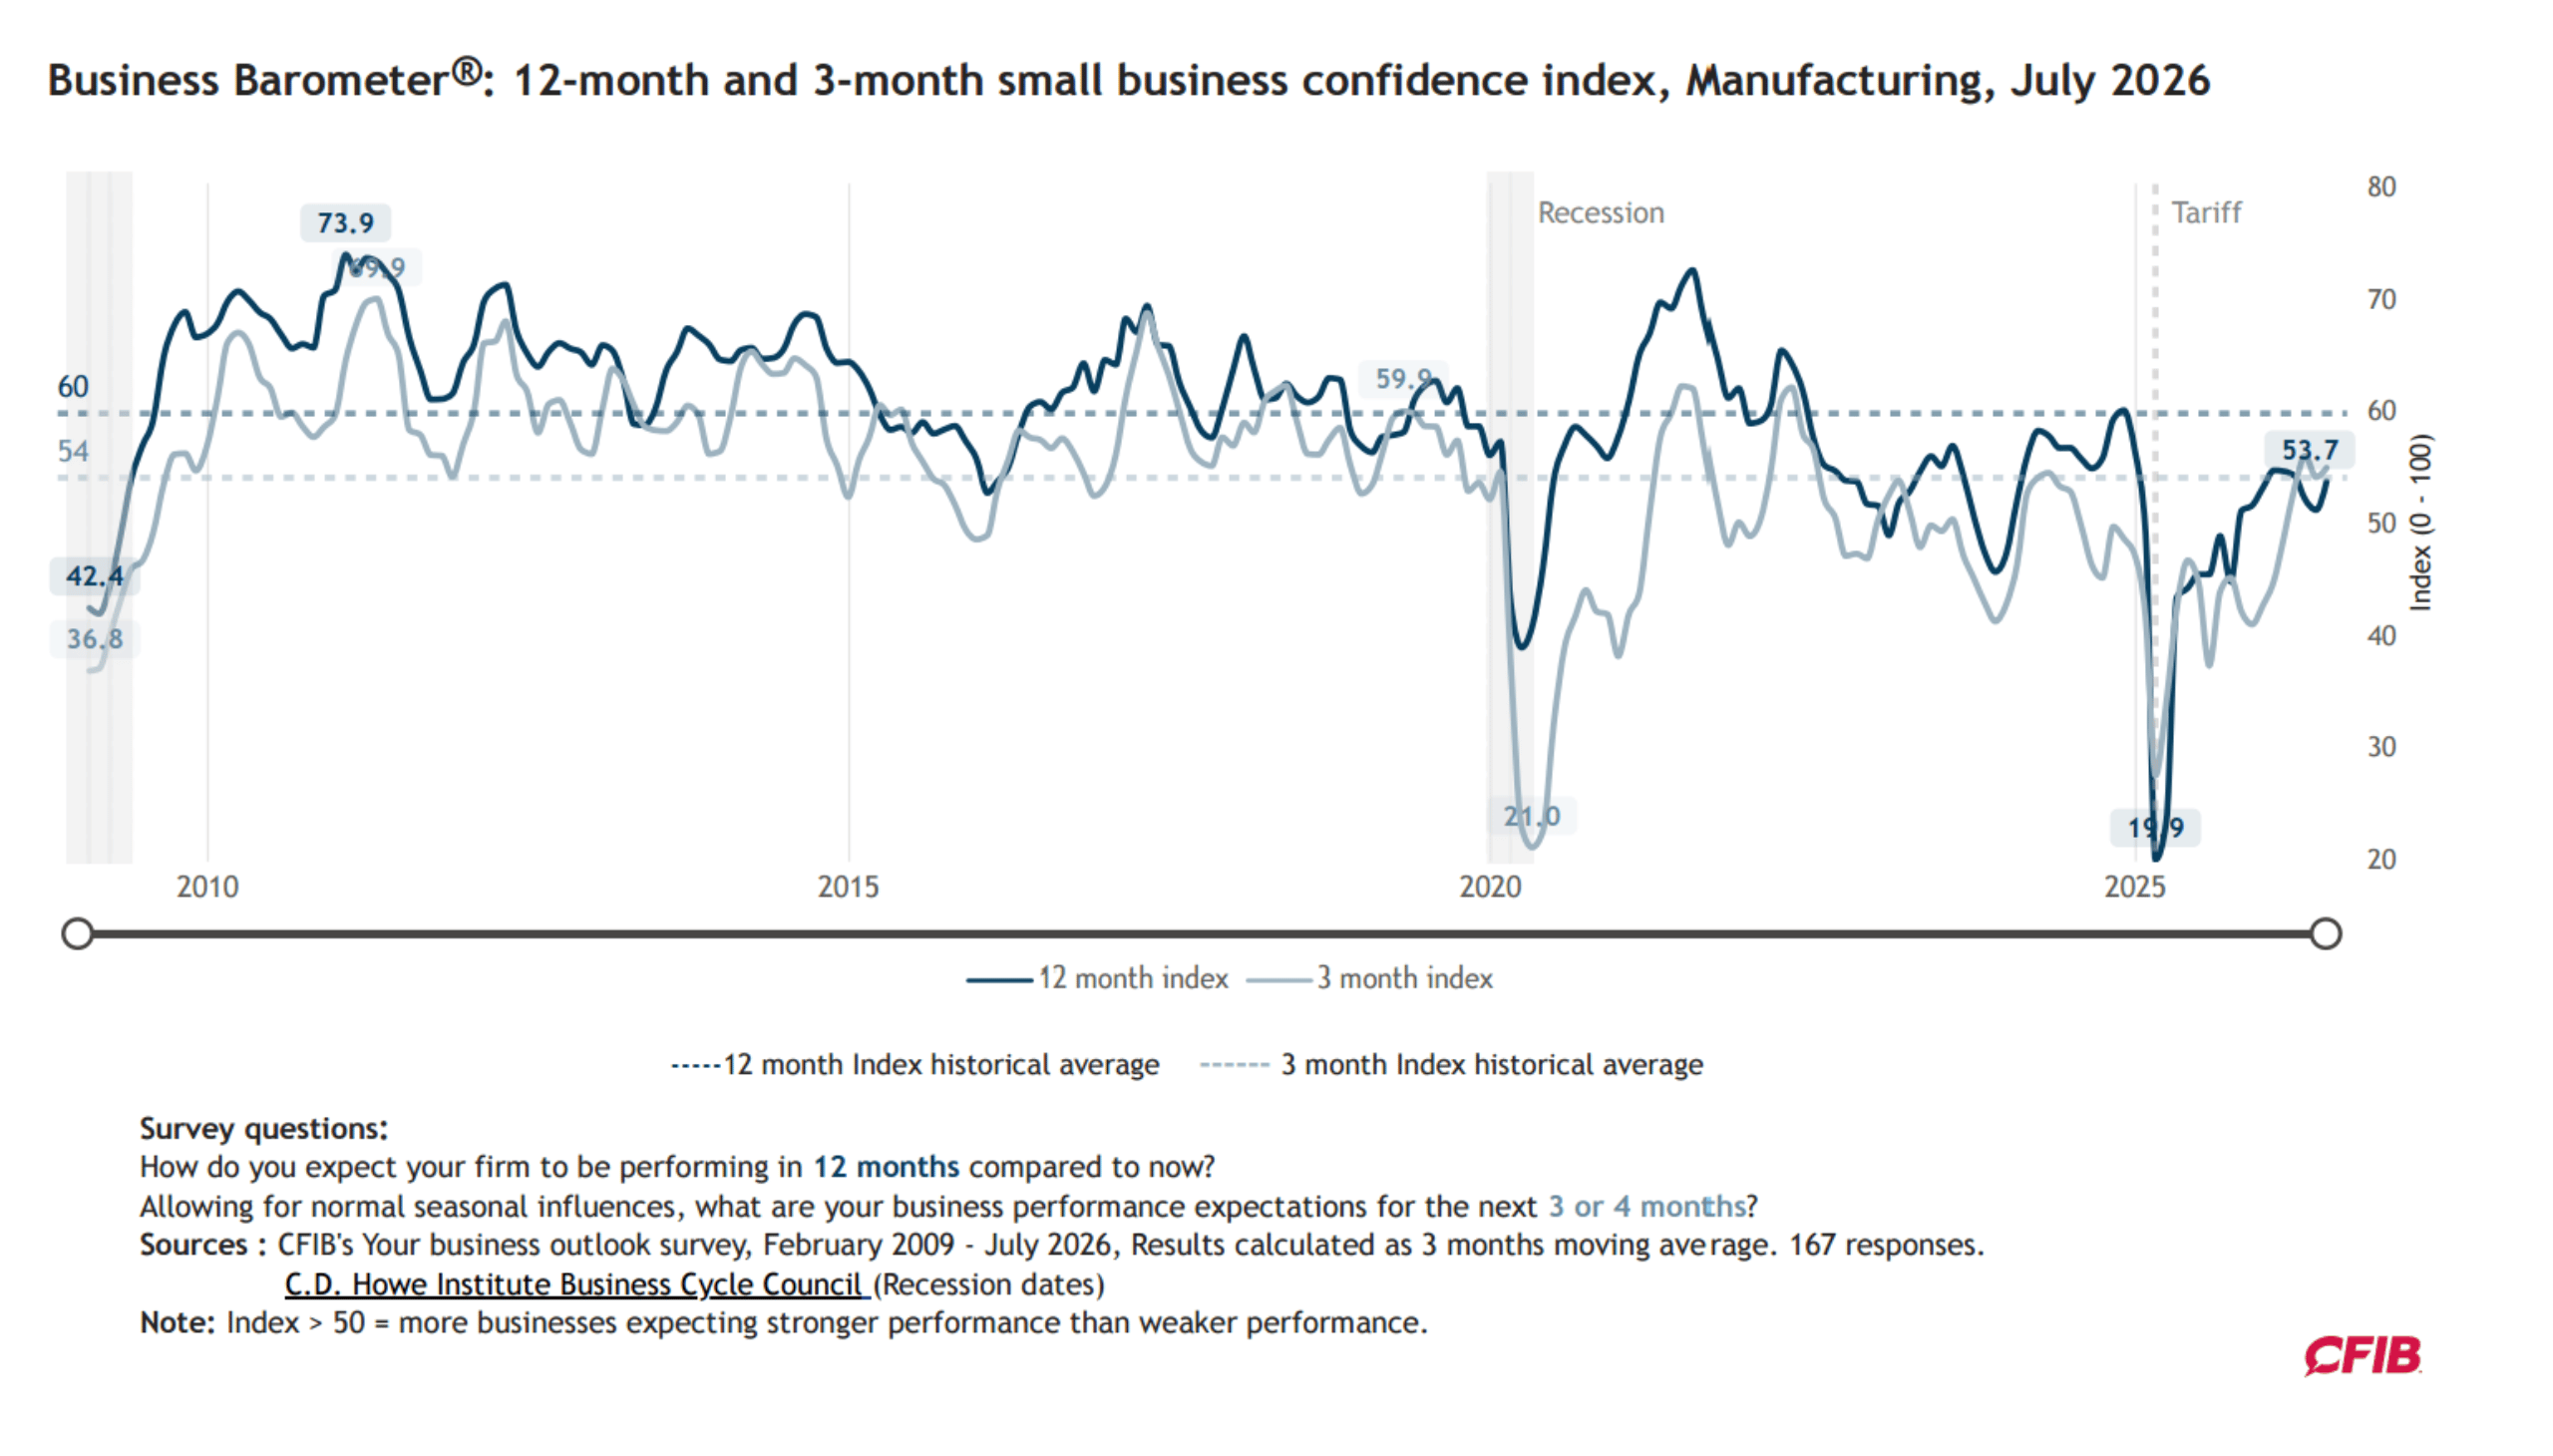
Long-term optimism among manufacturing firms improved in July (53.7) but continued to lag far behind its potential (60.1). The sector’s confidence hasn’t really recovered since 2023 and has been hit harder by tariffs than by either the 2008-09 recession or the pandemic.
About two-thirds of manufacturers (63%) reported shipping and receiving costs as a major constraint on business, which was more than double the 29% recorded in February 2026. Input product costs were squeezing 77% of manufacturers, almost twice the usual share for this sector. For more information, click here.
State of business health
Similar to June, the balance of opinion on the state of business health was better than in early Spring but still below the historical average of 21.
Inflation indicators
The average price increase dropped to 2.7% in July, while the average wage increase remained unchanged at 2.3%. For more details about small firms' price and wage increase plans, click here.
Other indicators
Full-time staffing plans showed also a timid improvement, with a slightly higher share of employers who were planning to hire (15%) than to lay off (11%). The current year to date has been better than the same time period last year, but still very modest by historical standards.
Insufficient demand remained the top constraint to business and production expansion, reported by 50% of business owners, but trending timidly downwards.
Cost‑related pressures were just as high in early July though, led still by fuel costs (60%), tax and regulatory expenses costs (60%), and insurance costs (60%). Despite a continued decrease since April 2026, fuel costs remained high amid ongoing geopolitical tensions. Product input and raw material costs, as well as capital and technology costs, remained a significant constraint, with 42% and 38% of SMEs respectively reporting them as major constraints, similarly to June’s levels.
Methodology
These results are based on 520 responses received from July 7 to 13 from a stratified random sample of CFIB members to a controlled-access web survey. Findings are statistically accurate to +/- 4.3 per cent 19 times in 20.
Every new month, the entire series of indicators is recalculated for the previous month to include all survey responses received in that previous month. Accordingly, June results were recalculated to include 22 additional responses beyond the 347 originally used.
Measured on a scale between 0 and 100, an index above 50 means owners expecting their business’s performance to be stronger over the next three or 12 months outnumber those expecting weaker performance.
Since February 2026, the survey includes two new data points on shipping and receiving costs; and on shortages of equipment and technology.
As of April 2026, our industry codes align fully with NAICS, resulting in slight composition changes in agriculture, natural resources, transportation, and health and education. Questions? Contact us directly.
Some of the visualizations have been prepared by Aarmi Patel, Data Analyst, PBI.
More details
Regional data about business optimism, price plans, limitations and cost constraints:
The Business Barometer, 2025 Retrospective.




 Share Article
 Print Article

